series
задает несколько диаграмм, которые нужно показать в одном компоненте chart
array series;
Example
webix.ui({
    view:"chart",
    type:"bar",
    ...
    series:[
        {
            value:"#sales#",
            color:"#58dccd"
        },
        {
            value:"#sales2#",
            color:"#36abee",
        }
    ]
});
Related samples
Details
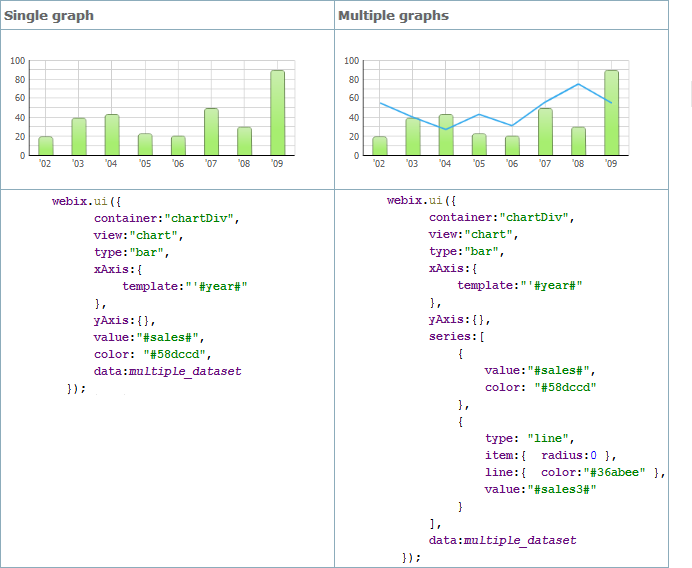
Если вы добавляете диаграммы одного и того же типа, вы можете не указывать атрибут type.
See also
API
Articles
If you have not checked yet, be sure to visit site of our main product Webix widget library and page of javascript graph library product.